

Autonomous Space Robotics Lab
Canadian Planetary Emulation
Terrain 3D Mapping Dataset
a200_met
[Home] [Overview] [Hardware] [Details] [Downloads] [References]
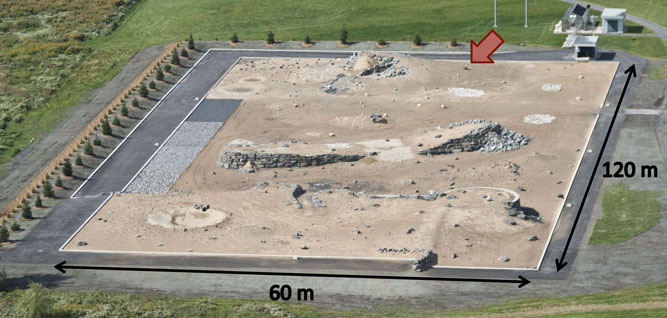
Photo credit: Équation Groupe Conseil, Inc.
Overview
This dataset consists of 25 laser scans obtained using a Clearpath Husky A200 at the Canadian Space Agency's (CSA) Mars Emulation Terrain (MET), located near Montreal, Quebec, Canada. In addition to the laser scans, this dataset also contains pose-to-pose transformation estimates between consecutive scan stops based on stereo visual odometry. This dataset was collected during a field demonstration conducted July 2011.
The CSA MET is an outdoor test facility with workspace dimensions of 120m x 60m. The terrain consists of scattered rocks on sand, along with some large ridge, crater, and outcrop features.
Hardware Setup
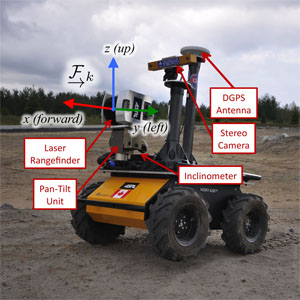 The Clearpath Husky A200 used to gather the dataset carried a number of payloads.
The relevant payloads for this dataset consisted of a vertically-scanning SICK LMS291-S05 laser rangefinder mounted on a Schunk PW70 pan-tilt unit to produce the 3D scans, a Honeywell HMR3000 inclinometer to measure rover inclination, a Point Grey Bumblebee XB3 stereo camera for visual odometry, and a DGPS antenna for ground truth positioning.
The laser scanner was configured for a vertical angular resolution of 0.5°, and the scans were constructed by linearly interpolating the pan positions of the laser slices through the slow 360° scan sweep. Based on the manufacturer's specifications, the SICK LMS291-S05 has a range measurement standard deviation of 0.01m.
As depicted in the figure to the right, the scan reference frame was defined to be the laser rangefinder center, with +x pointing forward, +y to the left, and +z up. The inclinometer sat on the rover top plate, and the stereo visual odometry estimates were transformed into the laser sensor frame.
Dataset Details
The 25 scans that compose this dataset were obtained during a exploratory traverse of the MET site. Visual odometry estimates were computed for rover navigation, and are provided to assist the alignment process. The covariances of the visual odometry estimates were determined through calibration experiments conducted in an indoor lab prior to the collection of this dataset. The estimated motions were compared to Vicon motion capture data, providing statistical characterization of the estimate accuracy. Since we were simulating an exploration task, the motion conducted between scans were limited by the maximum effective range of the laser scanner. While the majority of the scans were obtained with the rover sitting flat on the ground, one of the scans was collected while the rover was propped up on a large rock. The following image depicts an overhead view of the terrain, along with the scan locations and odometry measurements.
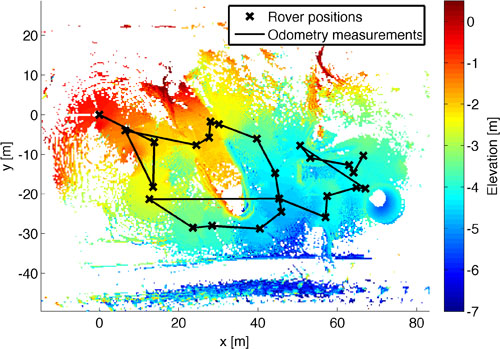
The ground truth sensor positions were provided by an on-board DGPS antenna, and the orientation values computed through manual application of a dense matching algorithm [1]. The position offset between the DGPS antenna and the laser rangefinder was measured manually. The ground truth reference frame was defined to be the same as the first scan pose.
Downloads
The a200_met dataset is available at ftp://asrl3.utias.utoronto.ca/3dmap_dataset/a200_met/.
[Download entire a200_met dataset (zip) | Compressed size: 71MB, Extracted size: 208MB]
References
[1] Besl P and McKay H. "A Method for Registration of 3-D Shapes." IEEE Transactions on Pattern Analysis and Machine Intelligence, 14(2):239-256, 1992.