

Autonomous Space Robotics Lab
Canadian Planetary Emulation
Terrain 3D Mapping Dataset
box_met
[Home] [Overview] [Hardware] [Details] [Downloads] [References]
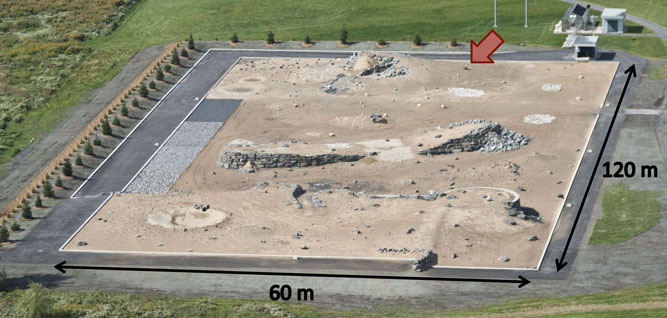
Photo credit: Équation Groupe Conseil, Inc.
Overview
This dataset consists of 112 laser scans obtained using a custom-built data collection platform at the Canadian Space Agency's (CSA) Mars Emulation Terrain (MET), located near Montreal, Quebec, Canada. This dataset was collected for mapping purposes during November 2011.
The CSA MET is an outdoor test facility with workspace dimensions of 120m x 60m. The terrain consists of scattered rocks on sand, along with some large ridge, crater, and outcrop features.
Hardware Setup
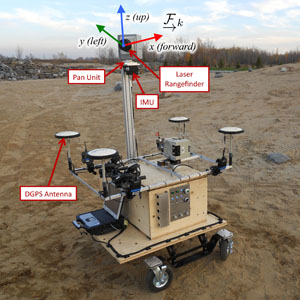 The platform used to gather the dataset carried a number of payloads.
The relevant payloads include a vertically-scanning SICK LMS111-10100 laser rangefinder mounted on a panning unit to produce the 3D scans, an IMU to measure the rover inclination, and a DGPS antenna array to provide ground truth positions and yaw.
The laser scanner was configured for a vertical angular resolution of 0.25°, and the scans were constructed by decomposing the 360° sweep into a series of 0.5° steps. Based on the manufacturer's specifications, the SICK LMS111-10100 has a range measurement standard deviation of 0.01m.
As depicted in the figure to the right, the scan reference frame was defined to be the laser rangefinder center, with +x pointing forward, +y to the left, and +z up. The IMU sat below the laser rangefinder.
Dataset Details
The 112 scans composing this dataset were obtained with the goal of producing a map of the workspace. As a result, the platform was carefully positioned to produce an approximately regular inter-scan spacing of 10m. Since the laser scanner was able to produce intensity information along with the range data, *.fcli and *.xyzi scans files are also included in this dataset, which correspond to the *.fcl and *.xyz file formats, respectively, with an additional column for intensity. Unfortunately, this dataset does not include *.est files, as the data has yet to be processed. The following image depicts an overhead view of the terrain, as well as the scan locations.
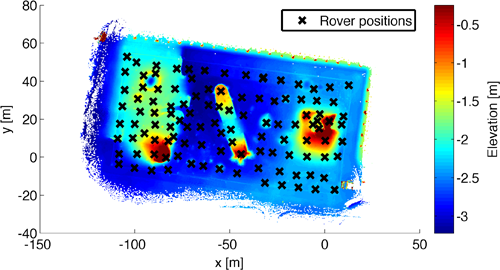
The ground truth sensor poses were obtained by aggregating the values from an on-board DGPS antenna array, resulting in accurate positions and yaw [1]. The position offset between the DGPS antenna and the laser rangefinder was measured manually. Unfortunately, due to the small baseline of the antenna array, accurate pitch and roll measurements could not be obtained from the antennas. As a result, the IMU measurements were incorporated to fill in the missing elements. Similar to the other datasets, the ground truth reference frame was defined to be the same as the first scan pose.
Downloads
The box_met dataset is available at ftp://asrl3.utias.utoronto.ca/3dmap_dataset/box_met/.
[Download entire box_met dataset (zip) | Compressed size: 656MB, Extracted size: 2.1GB]
References
[1] Eggert D W, Lorusso A, and Fisher R B. "Estimating 3-D Rigid Body Transformations: A Comparison of Four Major Algorithms." Machine Vision and Applications, 9(5/6):272-290, 1997.